How Can Real User Monitoring Detect Regional CDN Performance Issues?
Table of contents
You catch regional CDN issues with real user monitoring by tagging every real page view with where the user is and what they saw, then watching the right timing slices per region in near real time.
When p75 TTFB or largest contentful paint jumps in, say, Jakarta or Riyadh while other regions stay normal, you know the problem sits on the edge path for that geography.
Real user monitoring does not guess. With the right labels and a few well chosen metrics, you can detect regional CDN performance issues quickly:
What You Capture In RUM To See Regional CDN Problems
You do not need everything under the sun. You need the few signals that tell you where time went and where the user is.
- Geo and network context: country, region, city, and the user’s ASN or ISP.
- Device context: desktop vs mobile, viewport size, and effective connection type from the Network Information API. Keep in mind this API is limited outside Chromium.
- Navigation timings: DNS lookup, TCP connect, TLS, request start, TTFB, content download.
- Paint timings: largest contentful paint and first contentful paint.
- Resource timing for your CDN hostnames: per-file DNS, connect, TLS, TTFB, and transfer. To see these values on cross-origin assets, the CDN must serve Timing-Allow-Origin.
- Response metadata: HTTP status, protocol (H2, H3), and CDN headers like x-cache, cf-ray, x-amz-cf-pop, or any provider tag your edge adds. These must be exposed with Access-Control-Expose-Headers, or you can mirror them into Server-Timing.
- Error surface: 4xx and 5xx rates for static assets and HTML.
That is enough for RUM observability focused on the CDN path.
You can collect this with the PerformanceObserver API for paints and resources, the Navigation Timing API for page-level phases, and a small script to capture selected response headers via a lightweight beacon from your server.
The Regional Detection Workflow
Think of it as a funnel. You start broad, then zoom.
- Instrument your pages to send a beacon on important views. Include region, ASN, device, and a map from each resource URL to the CDN brand that serves it.
- Aggregate in near real time by region and ASN. Maintain rolling p50, p75, and p95 for TTFB and largest contentful paint, plus DNS, connect, and TLS.
- Compare a region to its own baseline and to sibling regions over the last 60 minutes. Baselines should be time-of-day and day-of-week aware. Divergence is your friend.
- Trigger alerts when p75 deviates materially for a sustained window and volume threshold. Example: p75 TTFB in Saudi Arabia is 50 percent above baseline for 15 minutes with at least 200 sessions.
- Drill into affected region → ASN → CDN hostname. Pull a sample of resource timing waterfalls and look at x-cache and POP identifiers.
- Check phase shifts. If DNS and connect are normal but TLS and TTFB rise, the edge is accepting connections but struggling to terminate or fetch. If DNS explodes for a subset of ASNs, you may have a resolver or routing wobble.
- Validate with a quick synthetic probe from the region to confirm you are not reading a sampling glitch.
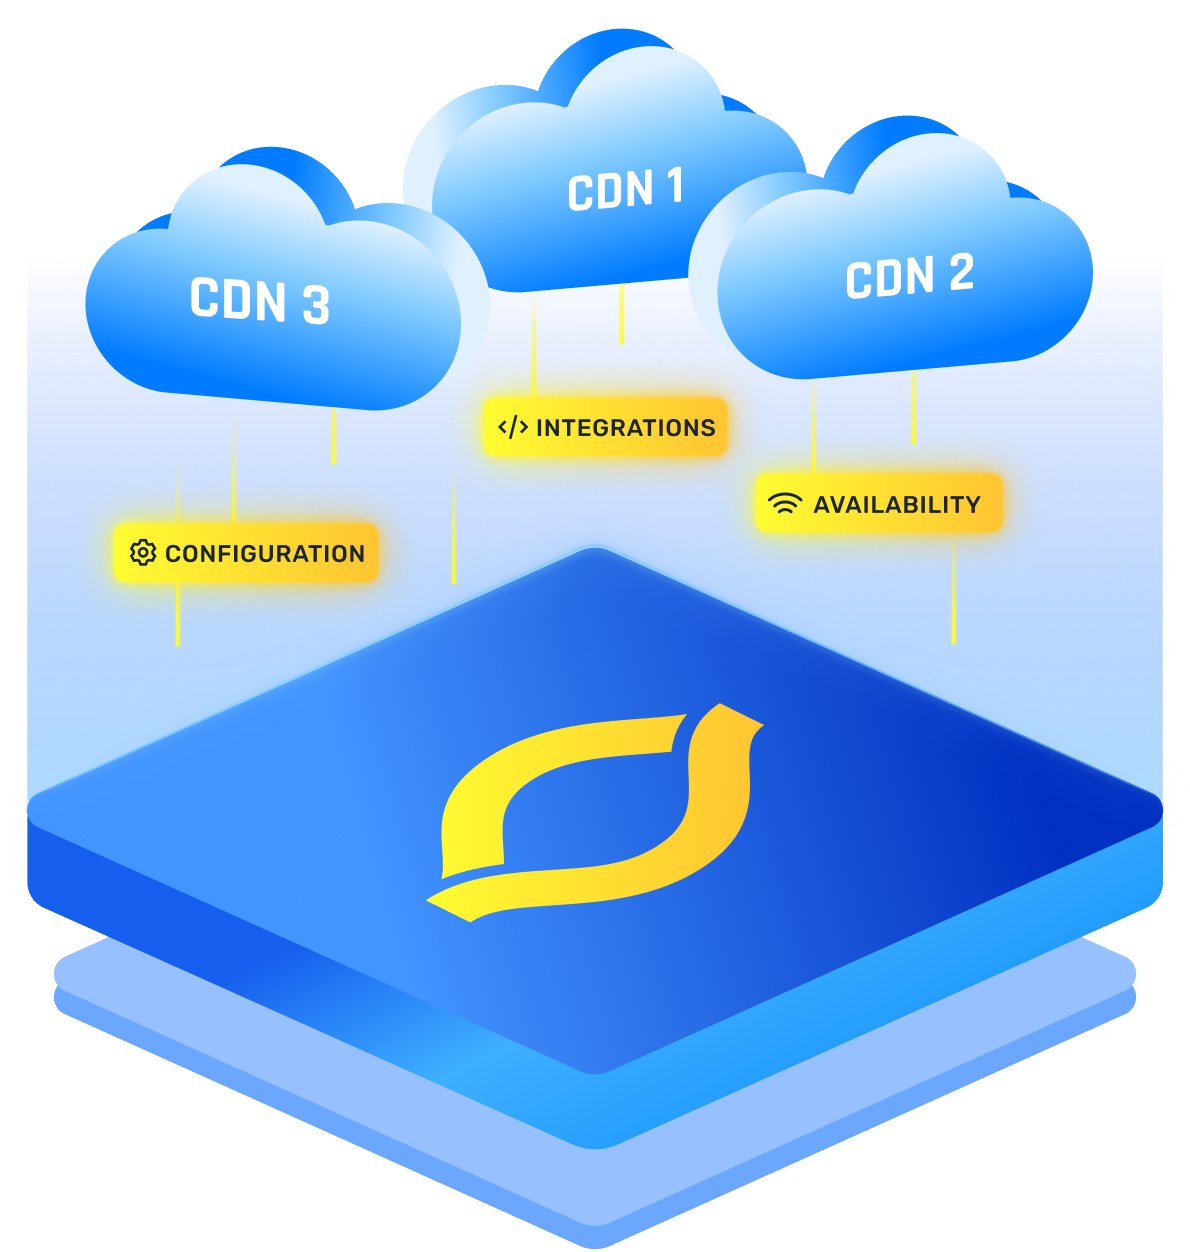
- If you run multi-CDN, compare the same asset on each provider. If one is clean and the other is not, you have enough evidence to switch traffic.
- Hand findings to your CDN support with the exact POP IDs, ASNs, timestamps, and sample request IDs.
Signals That Point To The CDN, Not Your App
You want attribution, not vibes. These patterns are strong hints the edge is at fault.
- HTML TTFB spikes across regions where the HTML is cached at the edge. Your origin processing time cannot explain that.
- Static asset requests show x-cache: MISS surging in one region only, with TTFB up and content download unchanged. That suggests a local cache eviction or backhaul problem.
- TLS time increases while DNS and connect are stable. The POP is overloaded or negotiating poorly in that geography.
- Protocol downgrades in the region. You logged H3 yesterday, now H2 or H1 dominates while LCP slips. That usually traces to edge or middlebox issues.
- Elevated 5xx from a CDN hostname, especially 522, 523, 502 styles that come from the edge, not your app.
- ISP clustering. If only users on two ASNs are slow and others in the same country are fine, you may have a route flap or peering issue at the CDN side toward those networks.
Watch → Interpret → Act
RUM can do you wonders if you use it correctly:
How To Build Alerts That Reduce Noise
You want useful pings, not a firehose.
- Base on p75, not averages. p75 best represents majority user pain without amplifying outliers.
- Gate on volume. Do not alert on fewer than 100 sessions per region hour, or 200 if your traffic allows.
- Pair metrics. Alert when LCP rises only if TTFB or TLS also rises. That avoids flagging unrelated layout shifts.
- Split by device class and effective connection type. A 3G spike is not the CDN’s fault.
- Require persistence. Two or three consecutive 5 minute windows keeps you from chasing transient burps.
A Simple RUM CDN Performance Debug Walkthrough
You notice from RUM monitoring that p75 largest contentful paint in the UAE rose from 2.3 s to 4.7 s between 14:00 and 14:20. Australia, Singapore, and the UK are flat. In the same UAE window, HTML TTFB climbed by 800 ms. DNS is normal. Connect is up by 120 ms. TLS is up by 400 ms. Static assets show x-cache: HIT but latency is elevated on first byte.
What I do next is zoom into ASN view. du and Etisalat both show the spike. Sample waterfalls show cf-ray values tied to a single POP code. Protocol mix shifted from H3 to H2 during the spike. That is textbook edge degradation in a single data center.
As a quick fix, I route 50 percent of UAE traffic to my secondary CDN and enable serve-stale-if-error for HTML. Within 5 minutes p75 LCP drops back under 2.6 s.
I capture all POP codes, timestamps, and request IDs and open a ticket with the primary CDN. You detected, attributed, and mitigated using RUM alone.


.png)
.png)
.png)