



Your dashboard says the stream is online. Servers are responding, the CDN is available, and average bandwidth looks healthy. Yet viewers are leaving during the first minute. The service works technically, but the experience is failing where it matters.
Quality of experience, or QoE, helps you measure that gap. It asks what playback felt like for the viewer, then connects that outcome to the delivery decisions your team can improve across each viewing session.
What Is Quality of Experience (QoE)?
Quality of experience is the quality a person perceives while using a digital service. In video streaming, it reflects whether playback starts quickly, stays smooth, looks clear, and responds naturally when the viewer seeks or changes programs.
QoE is not one raw network number. It is an interpretation built from signals. A five second startup delay may be serious even when the rest of the session is stable. A brief drop in resolution may barely matter if it prevents a long stall. Context changes the weight of each event.
For me, the best video streaming QoE view combines playback measurements with business behavior. You can see what happened in the player, where it happened, and whether the viewer continued watching. That keeps the analysis tied to a real outcome instead of a technical score.
How QoE Differs From Quality of Service (QoS)
The qos vs qoe distinction becomes clear when you separate the network from the person using it. Quality of service describes how the delivery system performs. QoE describes what the user experiences after network behavior, application logic, content quality, and device limits interact.
Imagine that a CDN path has low latency and no packet loss. Those QoS signals look good. The player may still receive a weak experience because the chosen rendition is badly encoded or the device cannot decode it smoothly. The reverse can also happen. A brief network slowdown may not affect QoE if the playback buffer absorbs it.
The Key Signals That Define QoE in Video Streaming
- Startup time measures how long the viewer waits after pressing play.
- Rebuffering ratio measures the share of viewing time spent stalled.
- Average delivered bitrate and resolution show the visual level the player sustained.
- Quality switch data shows whether playback remained stable or changed repeatedly.
Video quality monitoring data should not be averaged too early. A global average can look healthy while one city, internet provider, device model, or CDN path performs badly. Break results into groups, then inspect the distribution. The slowest portion of sessions explains complaints that the average hides.
Use OTT metrics together rather than chasing one perfect score. Startup time, stalls, visual quality, playback failures, and engagement form a more honest picture. A composite score can help you rank sessions, but the underlying measures tell you what to fix.
{{cool-component}}
How Multi-CDN Platforms Use QoE Signals to Steer Traffic in Real Time
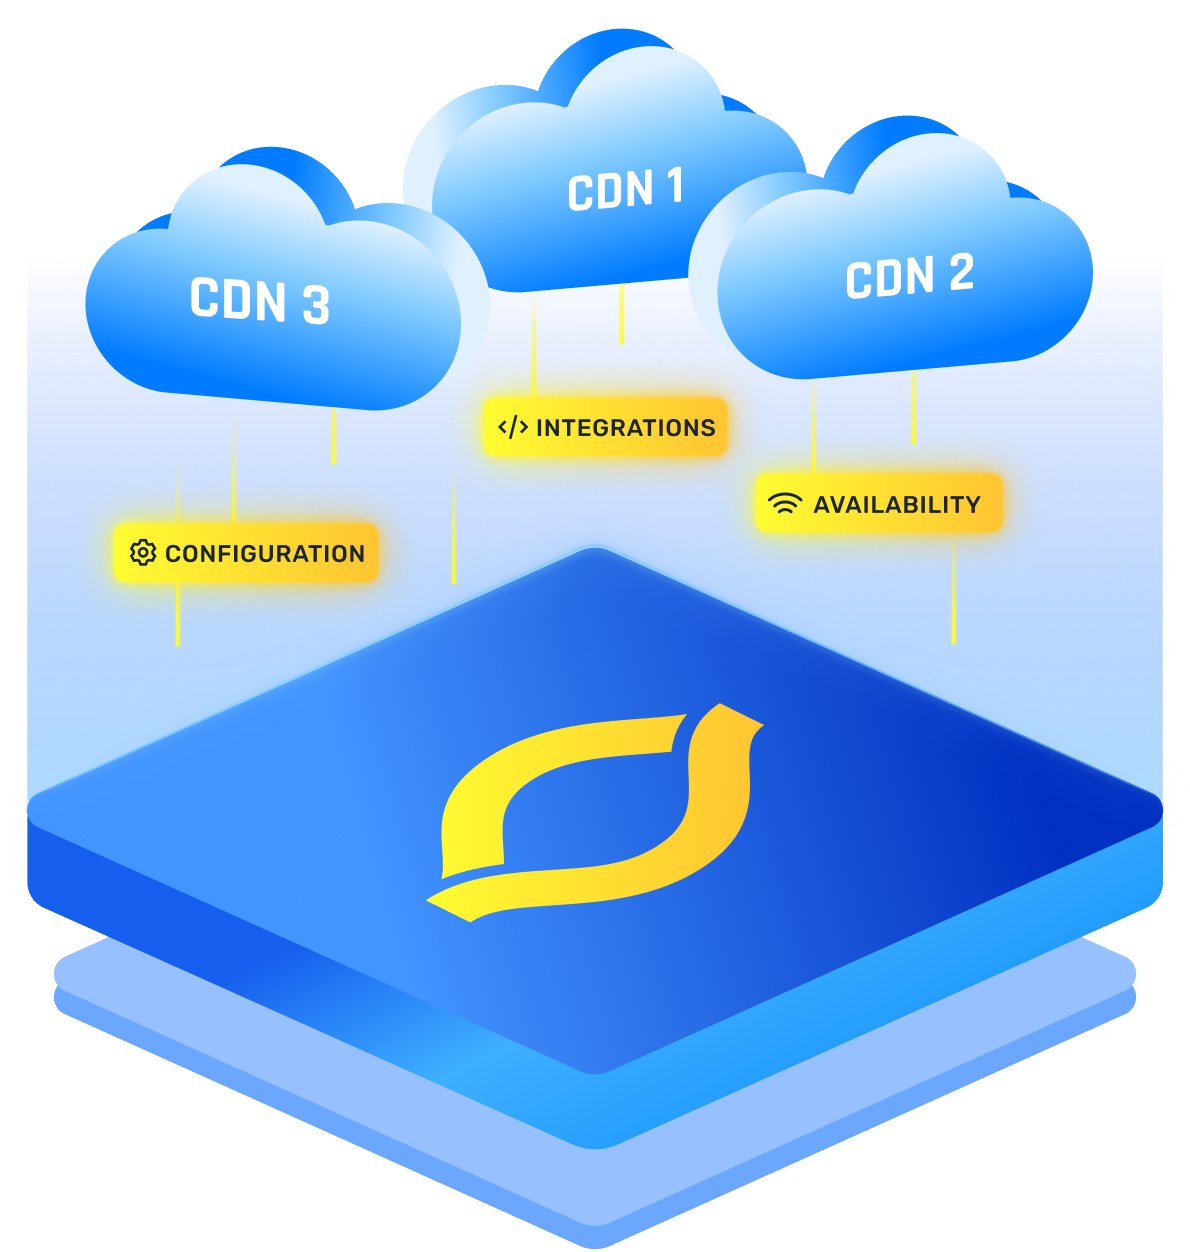
A multi CDN platform can compare delivery results across providers and move new traffic toward the path producing the best experience. The key is to steer from current, audience specific evidence instead of treating every CDN as equally strong in every location.
The control loop works in four stages:
- Players report session measurements such as segment time, stalls, and selected bitrate.
- The platform groups those measurements by provider, location, network, and device class.
- Routing logic compares recent performance with a safe baseline and confidence threshold.
- New viewers are directed toward a healthier path while the system watches the result.
This process needs guardrails. If you react to a tiny sample, one unusual session can cause unnecessary switching. If you wait too long, a real problem continues hurting viewers. Minimum sample sizes and rolling time windows keep the system stable.
Availability checks still matter, but they are only the first gate. A CDN can return HTTP 200 while delivering segments too slowly for smooth playback. QoE aware steering catches that gray failure because the player reports the consequence, not just the server response.
Keep security and configuration consistent when traffic moves. A faster route is not a better route if it uses the wrong token rules, misses required logs, or exposes the origin. Your steering decision should protect experience without creating a different operational problem.
Conclusion
QoE keeps your attention on the person. Network health explains only part of the story. Startup, stability, visual quality, and behavior reveal the result. Connect those signals to delivery paths so you can fix what viewers feel.
Frequently Asked Questions
Can QoE Be Measured Objectively Without Viewer Surveys?
Yes. Player telemetry can measure startup delay, stalls, errors, delivered quality, and session abandonment without asking the viewer. Those signals provide an objective behavioral view. Surveys still add useful context because two viewers may judge the same technical session differently, especially across content types and screen sizes.
What QoE Score Is Considered Acceptable for a Streaming Platform?
There is no universal acceptable score because scoring models use different inputs and weights. Build a baseline from your own service, content, devices, and audience. Then set targets for individual signals and compare changes over time. A score is meaningful only when its formula and business impact are understood.
Does QoE Vary for the Same Stream Across Different Viewer Locations?
Yes. Viewers can reach the same stream through different internet providers, routes, CDN edges, and congestion points. Device capability and local wireless conditions add more variation. That is why session level data should be grouped by geography and network instead of relying only on one average.
How Often Should a Streaming Platform Review Its QoE Data?
Operations teams should monitor important QoE signals continuously and alert on meaningful changes. Product and engineering teams can review deeper trends on a regular weekly or monthly cycle. Live events deserve tighter real time attention because a short failure can affect a large share of the audience at once.
How Does a QoE Score Differ From a Mean Opinion Score?
A QoE score may combine playback telemetry, media quality, reliability, and engagement using a platform specific formula. A mean opinion score traditionally summarizes human ratings on a simple scale, although models can estimate it. MOS can be one input or reference, while QoE usually represents the broader viewing experience.


