

A CDN should make your site faster and more reliable. That’s the whole point. But when traffic tanks, content fails to load, or regional performance varies wildly, the blame game begins. Was it your code? The user’s connection? Or the CDN’s own edge server halfway across the world?
Observability is the lens that lets you spot where the network struggles, where it shines, and where it needs a fix. You track patterns, catch failures before they spread, and measure the experience real users get at the edge.
What CDN Observability Means
You monitor what matters. You track what changes. And you look behind the edge to see what’s going wrong or what’s going great.
CDN observability is the practice of tracking CDN behavior in real time. It’s about making sense of performance drops, latency spikes, cache misses, TLS handshake failures, and region-level outages before they become support tickets.
Think of it as an eye on the edge. It helps you understand:
Observability shows you what CDN logs alone don’t: intent versus impact.
How CDN Observability Work
The best CDN monitoring tools mix outside and inside views. They test your CDN from the real world, and they pull data from inside the network.
- Outside-in monitoring means synthetic tests and real user measurements. You see what an actual visitor experiences when they click.
- Inside-out monitoring means pulling metrics, logs, and traces from the CDN itself. You see what servers do when that visitor’s request lands.
Both sides matter. If you only watch from the outside, you know the site feels slow but not why. If you only watch the inside, you miss the real-world pain.
{{cool-component}}
Popular CDN Observability Tools
You do not need to build your own monitoring stack from scratch. A number of CDN monitoring tools already exist that balance outside-in and inside-out views.
Each comes with its own strengths.
The smart play is usually to combine provider dashboards with an independent tool. Provider data gives you precision, but independent tools show you how the outside world experiences your site.
Together, they balance accuracy and perspective.
CDN Observability vs Traditional Monitoring and Logging
Traditional monitoring and logging tell you if a known metric crosses a line or if an error happened.
CDN observability goes further. It treats metrics, logs, and traces as a connected story so you can explore unknown issues, which is the real difference in monitoring vs observability for edge traffic.
Why CDN Observability Is Harder Than It Looks
Unlike a normal server, a CDN is not one machine. It’s thousands of edge nodes. Each has different load, different cache state, and possibly different TLS behavior.
You might test your homepage and see a 90ms load time. But a user in Brazil might hit a cold cache node, and wait 700ms. Without region-aware observability, you never know.
Here’s what often goes wrong when teams skip proper monitoring:
- False confidence from averages: 80ms average latency looks fine, but hides that 5% of users are suffering.
- Origin overloads: Cache misses silently push too much traffic to origin, which crashes and causes 503s. If your CDN monitoring tools don’t watch origin pull rates, you won’t catch it early.
- TLS and handshake issues: Especially with shared edge infrastructure, users may hit a congested server and get timeout errors during negotiation.
- Bad routing: Sometimes a CDN routes users to the wrong edge POP due to DNS misconfiguration or poor Anycast logic.
You cannot fix what you don’t see. That’s the truth of CDN observability.
{{cool-component}}
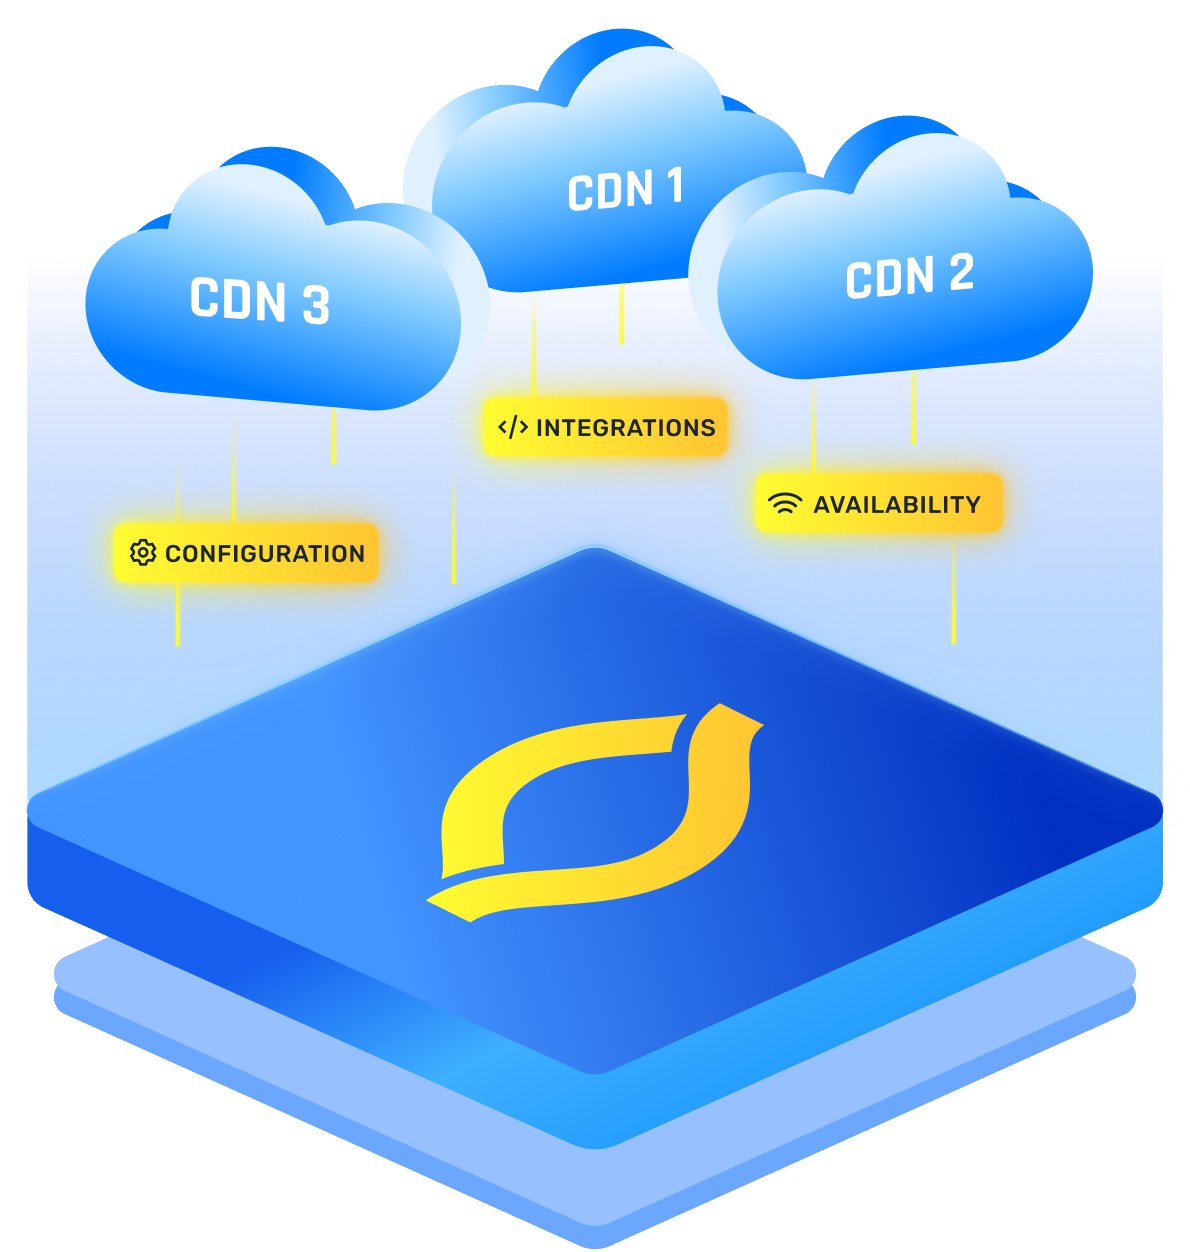
Observability in Multi-CDN Architectures
When you run a multi-CDN setup, observability is not just a “nice extra,” it is the control panel that keeps all providers in sync. Each CDN has its own logs, metrics, and dashboards. Without a shared view, you cannot tell which edge, route, or provider is actually slowing users down.
A good multi-CDN observability setup pulls data from every CDN into one place. You line up cache hit ratios, error rates, latency by region, and routing decisions across providers, then compare them side by side.
That lets you see patterns like “CDN A is faster in Europe, CDN B is stronger in Asia” instead of guessing.
With that view, you can:
- Route traffic toward the provider that performs best in each region
- Catch when one CDN starts returning more 5xx errors or timeouts than the others
- Spot cache or TLS issues that only appear on a single network
- Test new CDNs safely by watching their performance before sending them more traffic
How To Choose The Right CDN Monitor
A CDN monitor should not just tick boxes, it should fit your specific traffic patterns and team workflow. Picking the right tool comes down to matching what you need to what the tool does best.
Think in three angles:
The best choice is the one that shows you the data you will actually act on, in a way your team can use daily.
Conclusion
A CDN without observability is like flying blind at night. You can run fast, but you cannot control the bumps. With proper CDN observability, you get a clear map: where traffic flows, where edges stumble, and where fixes bring the biggest wins.
The real value is not in spotting problems. It is in seeing the full story before users ever notice.
FAQs
How does CDN observability differ from traditional monitoring vs observability approaches?
CDN observability combines metrics, logs, and traces so you can ask open questions about edge behavior. Traditional monitoring vs observability is about scope. Monitoring checks known thresholds. Observability lets you dive into a slow path, a bad POP, or a cache pattern you did not predict before.
Why is observability and monitoring essential for maintaining multi-CDN performance?
In a multi CDN setup, observability and monitoring keep you from guessing which provider failed first. Central dashboards show latency, errors, and routing per vendor. With that view, you can shift traffic, tune cache rules, or change routing before users feel slowdowns or see errors in key regions.
What’s the relationship between observability vs visibility when analyzing edge network performance?
Visibility is basic access to data, like logs or graphs from each POP. Observability vs visibility is about depth. Visibility says what happened. Observability helps you understand why it happened by linking user paths, origin calls, cache behavior, and network hops into one story across the edge network.
How does service observability improve the detection of latency and cache issues across CDNs?
Service observability treats each CDN and origin facing component as a service with clear signals. You see which service adds latency, misses cache, or returns errors. By tracing requests across services, you can spot where cache rules fail or where a single region drags down the whole path.
In what ways does application observability help optimize user experience at the CDN edge?
Application observability connects frontend events, API calls, and CDN responses. You see how edge caching, redirects, or TLS choices affect real user journeys. With that link, you can adjust cache keys, TTLs, and routing rules so the CDN edge serves faster pages and smoother interactions for your users.