

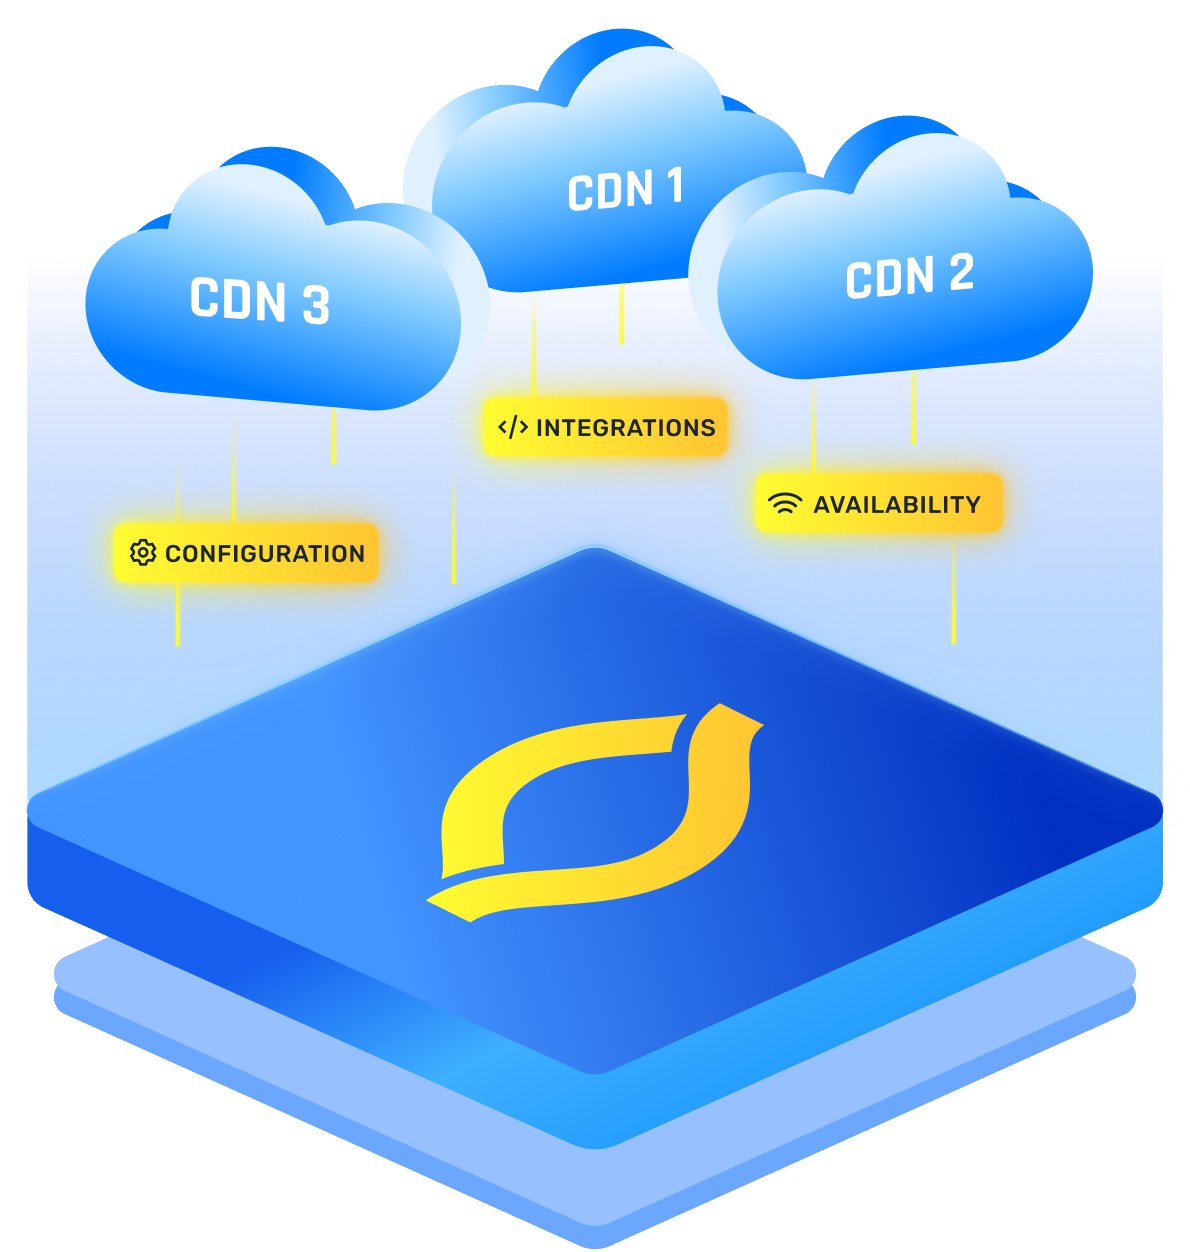
What’s the Role of Real User Monitoring in CDN Testing?
Real user monitoring is the reality check in CDN testing. You use RUM data to see what your users actually experience on different networks, devices, and geographies, then use that truth to validate vendor claims, catch blind spots that synthetic tests miss, and guide tuning, rollouts, and traffic steering.
I treat RUM monitoring as the source of truth that turns lab-perfect CDN tests into decisions you can trust in production.
What Real User Monitoring Adds To CDN Testing
Synthetic tests are great at isolating variables and proving a point. Real users introduce chaos that your CDN must survive. RUM captures that chaos and turns it into actionable signals.
You see how Anycast routing plays out for people on congested mobile networks at 7 p.m., how a small ISP in one region gets sent to a suboptimal edge, and how cache policies behave under real load, not just in a controlled script.
In CDN testing, RUM answers questions like these:
- Are users in Country A or on ISP B consistently seeing slower time to first byte than everyone else?
- Did enabling HTTP/3 actually reduce connection and TLS overhead for real traffic, or did most clients fall back to HTTP/2?
- When you adjusted cache TTLs, did first byte times tighten for real users, or did origin latency still leak through during traffic spikes?
- Did a vendor routing change last night help your long tail, or just your median?
I use RUM to verify that a change that looks good in a staging canary also holds up when the messiness of the last mile, device diversity, and real cache churn kicks in.
How RUM Complements Synthetic Tests
You need both. Synthetic user monitoring runs scripted page or API journeys from chosen locations and is repeatable and precise.
Synthetic network monitoring runs low-level checks like DNS resolves, TCP, TLS, and traceroutes from controlled probes. RUM sits beside them and tells you how customers actually fared.
You stitch these together. Use synthetic to prove cause, then use RUM to prove impact.
If synthetic shows better TTFB from a new edge in Tokyo, RUM tells you whether users in Japan on different ISPs actually benefited and at what hours.
Metrics That Matter From RUM For CDN Testing
You care about timings that map cleanly to CDN behavior. In browsers, Resource Timing and Navigation Timing give you these. Keep it focused:
- DNS lookup time. Indicates DNS path quality and resolver choice issues that can affect CDN hostname resolution.
- TCP connect time. Captures network distance and congestion effects that CDN routing should minimize.
- TLS negotiation time. Highlights protocol and cipher overhead, and reveals HTTP/3 versus HTTP/2 behavior via connection setup differences.
- Time to first byte. Your primary CDN signal for cache effectiveness and edge proximity. High TTFB with normal connect often means cache miss or slow origin fetch.
- Content download time for static assets. Surfaces throughput problems or congestion on specific routes.
- Redirect time. Shows if CDN-level redirects are adding latency for certain regions.
- Protocol and version. Observe client distribution across H2 and H3 to see if your change matters in practice.
If you control the origin or set CORS appropriately, you can also read selected response headers in RUM beacons. That lets you attach context like cache status for same-origin assets.
When available, server-timing headers are gold for exposing edge and origin phases. If you cannot access those headers cross-origin, lean harder on the timing patterns above.
Here is a quick mapping to keep you oriented:
Using RUM To Diagnose CDN Issues
When something looks off, follow a simple path:
- Segment by geography and ISP. If only one ISP in one country has inflated connect and TLS times, you are likely seeing a routing or peering quirk. Escalate with your CDN using evidence that speaks their language.
- Compare connect versus TTFB. Normal connect with high TTFB points to cache misses or slow origin fetches. Check if only HTML is affected while static assets are fine, which implies origin issues.
- Check protocol usage. If a region does not adopt HTTP/3, your observed gains will be limited. Consider keeping H2-tuned optimizations in that path.
- Look at hour-of-day patterns. If TTFB spikes only during evening peaks, edge saturation or origin capacity might be the culprit. Use synthetic checks to confirm capacity from the same region.
- Inspect asset-level timings. Large hero images or JS bundles served via the CDN can reveal throughput or compression issues that do not show on tiny HTML responses.
You do not need perfect precision to be effective. You need consistent comparisons that point you to the right layer to fix.
Practical CDN Testing Scenarios Where RUM Decides
I treat these scenarios as repeatable plays.
- Enabling HTTP/3. Confirm handshake time drops and that a meaningful share of clients actually stay on H3 in your key regions.
- Tuning cache TTLs. Watch TTFB distributions tighten after increasing TTLs on HTML or APIs, and verify origin load falls during peaks.
- Changing image optimization at the edge. Measure download times for large images across device classes. If mobile users on 3G do not benefit, revisit formats and sizing rules.
- Vendor comparison. Split real traffic 50 or 90 to 10 between two CDNs and watch p90 TTFB per country and ISP. Choose the winner with data that reflects your audience.
- Regional incidents. When a POP degrades, RUM will light up specific geos and ISPs. Use this to justify a temporary traffic shift or to escalate with evidence.
Each uses the same RUM slices and the same acceptance criteria.
What You Get When You Do It Right
- Confidence that a change helps real users, not just synthetic probes.
- Clear per-country and per-ISP SLOs that align with how your traffic actually behaves.
- Faster incident triage because you can separate last mile, edge, and origin with a few charts.
- Leverage with vendors because you can show user-impact metrics rather than argument by anecdote.
- Smarter multi-CDN steering since you can pick winners by geography based on reality.
That is the role of RUM in CDN testing. You let synthetic user monitoring and synthetic network monitoring ask precise questions, and you let RUM answer the only one that matters to your customers.
Did it get faster where they live, on the networks they use, at the times they show up. If I am calculating this right, that single answer is what turns CDN testing from checkbox work into material performance wins.