
How to Audit CDN Expenses: 5 Steps to Spot Hidden Costs
Learn 5 key steps to audit CDN expenses, uncover hidden costs, and gain clarity on pricing to optimize spend and boost efficiency.

You open the latest bill and it feels like a city after rain. Small puddles everywhere, but when you add them up, you are knee deep. CDN prices often look simple at first glance. Then the line items, regions, and features start to multiply.
If you want to audit CDN expenses with confidence, you need a clear map, a repeatable process, and a few quick wins that you can apply the same day. The five steps below do exactly that.
Where Do CDN Expenses Hide?
Use this table as your field guide before you start the audit. You will keep coming back to it.
Goal in this section is awareness. In the steps that follow, you will turn awareness into action and lower the true cost of CDN delivery.
{{promo}}
Step 1: Make Spend Visible and Assign it to Owners
If you cannot see it, you cannot fix it. Start by turning a vague monthly total into a clear story you can act on.
Build your cost data set
- Export raw cost and usage from your provider. Use hourly or daily grain if possible.
- Pull matching performance data. You need GB by region, request counts, cache hit ratio, and origin pulls.
- Collect change logs. You want a timeline of config edits and deploys to tie cause to effect.
- Stage the data in a queryable place. A warehouse or a FinOps tool is fine.
Then, create a small but strict tag set. Make it mandatory.
Run a daily report of untagged resources. Escalate anything untagged after two days. Untagged items block you from a clean budget CDN review.
Produce a Simple Showback
Show every team what they spent last month. Keep the layout simple.
Two things usually happen the first week. You find zombie resources that nobody owns. You also find features still enabled for retired apps.
Turn both off and you reduce CDN expenses before touching architecture.
Step 2: Read Your Traffic by Place and by Time
CDN prices change by region. Your traffic also changes by hour and by day. You need both views to model the true cost of CDN delivery.
Map Region Mix to Your Rates
Make a small table with your real traffic and your actual contracted rates. Replace the placeholders with your numbers.
Blended cost per GB
Blended = (Σ GB_region × Rate_region) ÷ Σ GB_region
Why this matters: a shift of only a few percent into a premium zone can erase savings elsewhere. When you audit CDN expenses, always show both the volume share and the cost share per region.
Measure Volatility and Burst Risk
Compute two numbers from the last 60 to 90 days.
- Peak to average ratio
- 95th percentile hourly egress
This shows how spiky you are. Then run a simple what if.
If we repeat last month under a pure usage plan:
Cost_usage = Σ(GB_region × Rate_region) + request_fees + features
If we repeat last month under a commit plan:
Cost_commit = Commit_fee + overage + request_fees + features
If Cost_commit wins in at least half your scenarios, move to a commit. If you run large launch days, also model a percentile plan where the top 5 percent of peaks is ignored.
This style of plan can stabilize a budget CDN when traffic is bursty.
Step 3: Fix Caching and How the CDN Touches Origin
Cache hit ratio is your main money lever. Every hit avoids origin egress and cache fill. Every miss is paid at least twice.
Track both request hit ratio and byte hit ratio. Put them next to dollars on the same dashboard.
A raise of a few points can lower the cost of CDN delivery more than any other single move.
Run a Fast Config Audit
Use this eight item checklist. Fixes here are high impact.
- Cache Control headers exist on all static assets
- TTL in the CDN is not shorter than the header for those assets
- Query string rules ignore tracking and non variant params
- Cookies not used for cache keys unless truly needed
- Negative caching is on for 301, 302, 404, and 5xx with short TTL
- Respect origin ETag and Last Modified for revalidation, not full fetch
- Directory index and trailing slash rules avoid duplicate objects
- Robots and well known paths cached briefly to deflect crawlers
Normalize Cache Keys
If your URLs carry many query params, you likely store duplicates. Define a custom cache key that keeps only the few that change the response. Drop the rest.
This single change often lifts hit ratio by a healthy margin and will reduce CDN expenses without touching product code.
Add an Origin Shield if you Have Many PoPs
An origin shield is a central cache inside the CDN. Edge locations fetch from the shield first. The origin receives far fewer requests.
Simple shield model
Your rates will differ. The structure will not. The shield reduces origin egress even when overall traffic climbs.
Step 4: Cut the Payload Before You Ship It
Total cost equals volume times price. You already worked the price by region and plan. Now shrink the volume. These wins improve performance and lower the cost of CDN delivery at the same time.
Do two quick checks.
- Confirm compression for HTML, CSS, JS, and JSON. Look for a content encoding header of br where supported. If you only see gzip, you likely leave savings on the table.
- Minify CSS and JS in production. This is a build step. It needs no runtime changes.
Expected result for modern sites is a 15 to 25 percent cut for text payloads. That is permanent savings every month.
Images
Images usually eat the largest share of GB.
- Serve modern formats such as WebP or AVIF where the client supports them. Keep JPEG or PNG only when you must.
- Resize on the server or at the edge so that the browser never downloads oversized images.
- Use lazy loading for off screen images. That reduces first view bytes and request pressure.
Video
If you serve video, use adaptive bitrate. That means multiple bitrates and a player that picks the next chunk based on current network. Also confirm you segment with short chunks.
Large chunks waste bandwidth on mid stream seek and exit.
APIs and Dynamic Content
Two simple ideas work well.
- Cache safe GET responses for a short time at the edge. Even a minute helps.
- Collapse duplicate requests with request coalescing so only one pass through reaches origin during a cache miss.
Quick Win
Step 5: Review Providers, Plans, and Contracts
By now you know your profile. You can compare vendors on your data, not a generic calculator. This is where you tune the plan and, if it helps, the architecture.
Share only the facts that matter.
- Monthly GB by region
- Monthly request count by type
- Feature usage like WAF rules, edge function invocations, and log volumes
- Hit ratios and origin egress
Ask vendors to price that exact mix. This keeps the conversation honest and gives you a clean way to budget CDN spend for the next quarter.
You have four common choices. Match them to your volatility.
- Pure usage with volume tiers
- Commit to a spend for a lower rate
- Flat plan for a bundle of GB and requests
- Percentile style plan that ignores a small share of peaks
Use the Step 2 simulation to pick the winner. Recheck every two quarters or when you ship a big media feature.
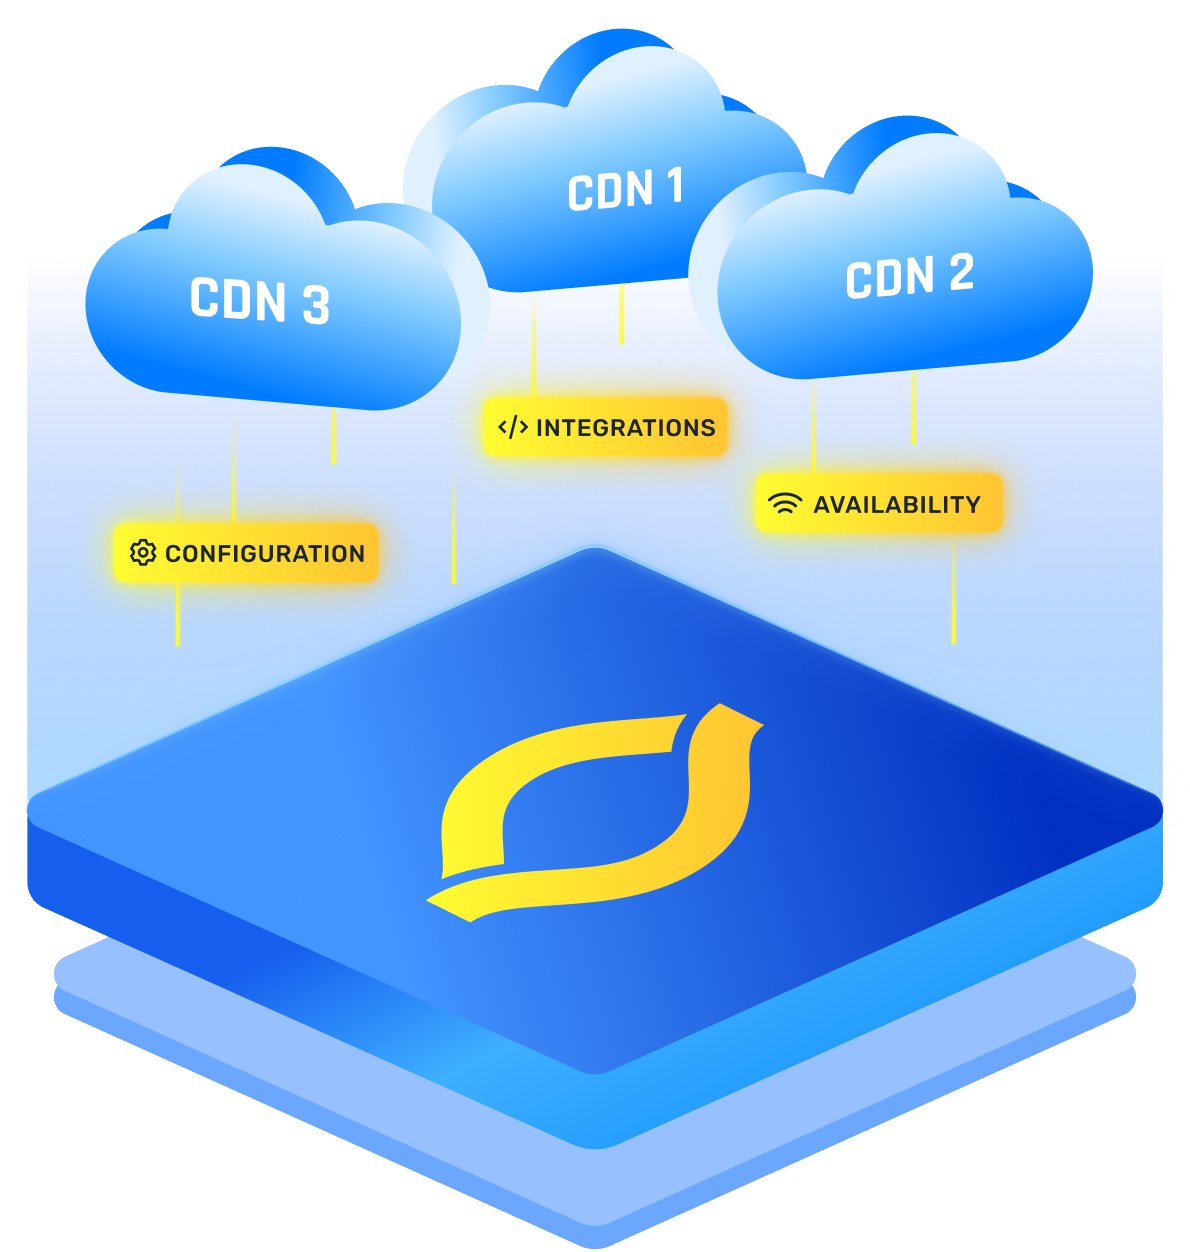
Consider a Multi CDN Setup
One provider might be cheaper in North America while another shines in Asia. You can route by geography and performance. You also gain redundancy. Start simple.
Send two regions to the second provider and compare both cost and user metrics. If the blended rate drops and uptime improves, expand. If not, keep your current setup and focus on caching.
Price is Not the Whole Bill
Feature pricing can flip the result.
A provider with a slightly higher per GB rate can still be cheaper on total cost when the bundled features match your workload.
Go in with two kinds of proof.
- A clean traffic profile and seasonality chart. This supports any commit you offer.
- Efficiency metrics. A high cache hit ratio makes you a profitable customer for any CDN. Use that to argue for a better rate or free trial of a shield feature.
Here’s your negotiation script:
- We can commit to X TB per month for Y months based on audited usage.
- Our hit ratio is above 95 percent and our origin egress is low. Serving our traffic is efficient for you.
- We need WAF for two zones and log streaming. Price those as part of the package.
- If you match or beat our current blended rate and include a shield trial, we can move two regions in the first month.
{{promo}}
Auditing CDN Expenses - Checklist
Here is the end to end flow you can repeat every month. It fits on one page and it keeps your budget CDN story tidy.
- Refresh raw cost and usage with tags enforced
- Update region mix and recompute blended cost per GB
- Review hit ratios and origin egress against targets
- Apply payload fixes and recheck heavy assets
- Validate plan choice and adjust commit if needed
Put the five numbers below on your team wall. They act as your speedometer for both performance and spend.
Conclusion
When you audit CDN expenses with this five step process, the bill stops being a mystery. You see what each line means, you tie it to an owner, and you fix the costly paths first. You improve cache behavior, shrink payloads, and choose a plan that fits your traffic shape.
That combination lowers the cost of CDN delivery in a way that lasts. As your audience grows, your CDN prices will no longer grow out of control.
FAQs
How can I identify unexpected charges in my CDN billing?
Export the itemized invoice and map each line to usage logs. Look for cache fill, origin egress, request counts, regional uplifts, WAF, edge compute, and log streaming. Tag every resource, then compare your blended per GB against contracted CDN prices. Align spikes with change logs to pinpoint the exact change.
What tools can help audit CDN usage and expenses?
Start with your provider’s cost and usage exports and real time analytics. Query them in a warehouse like BigQuery or Athena. Add synthetic tests and RUM for traffic context. Use FinOps dashboards for showback and alerts. Correlate spend to deploy logs so you can explain every cost of CDN changes.
What are the key steps to effectively audit CDN expenses?
Make spend visible with tags and ownership. Analyze region mix and volatility over time. Raise cache hit ratio and reduce origin pulls. Shrink payloads with compression and modern media. Compare providers and pricing models using your real mix to choose the best plan.
How do traffic spikes or sudden growth impact CDN costs?
Spikes drive you into higher tiers and create more request, WAF, and cache fill charges. Burst traffic also increases origin egress and can blow your budget CDN plan. Model peaks with hourly data and test usage, commit, flat, and percentile plans. Add bot protection and rate limits to avoid paying for noise.
Are there ways to optimize CDN configurations to reduce costs?
Yes. Tune caching to reduce CDN expenses fast. Set Cache Control and long TTLs on static assets. Normalize cache keys to ignore tracking parameters. Enable negative caching for errors. Add an origin shield to collapse misses. Use Brotli, WebP or AVIF, responsive images, lazy loading, and short edge caches for safe APIs.
How can I compare CDN pricing models to find the most cost-effective option?
Build an apples to apples model with your region mix, GB, requests, and feature use. Price it across vendors and plans. Simulate usage, committed spend, flat bundles, and percentile billing. Include WAF, logs, and edge compute. Pick the lowest total cost of ownership, not just the lowest sticker CDN prices.